Total return
The total Fund return came in at 4.9% in 2016, 2.8%-point lower than 2015 (7.7%). Main driver for the decrease of the fund return is twofold: disposition in 2015 of a non-health investment with a high return. Secondly because the growth strategy of the Fund. In this strategy the Fund acquired buildings to built and the capital required for these projects did not deliver direct return until delivery of the building (i.e. rental income).
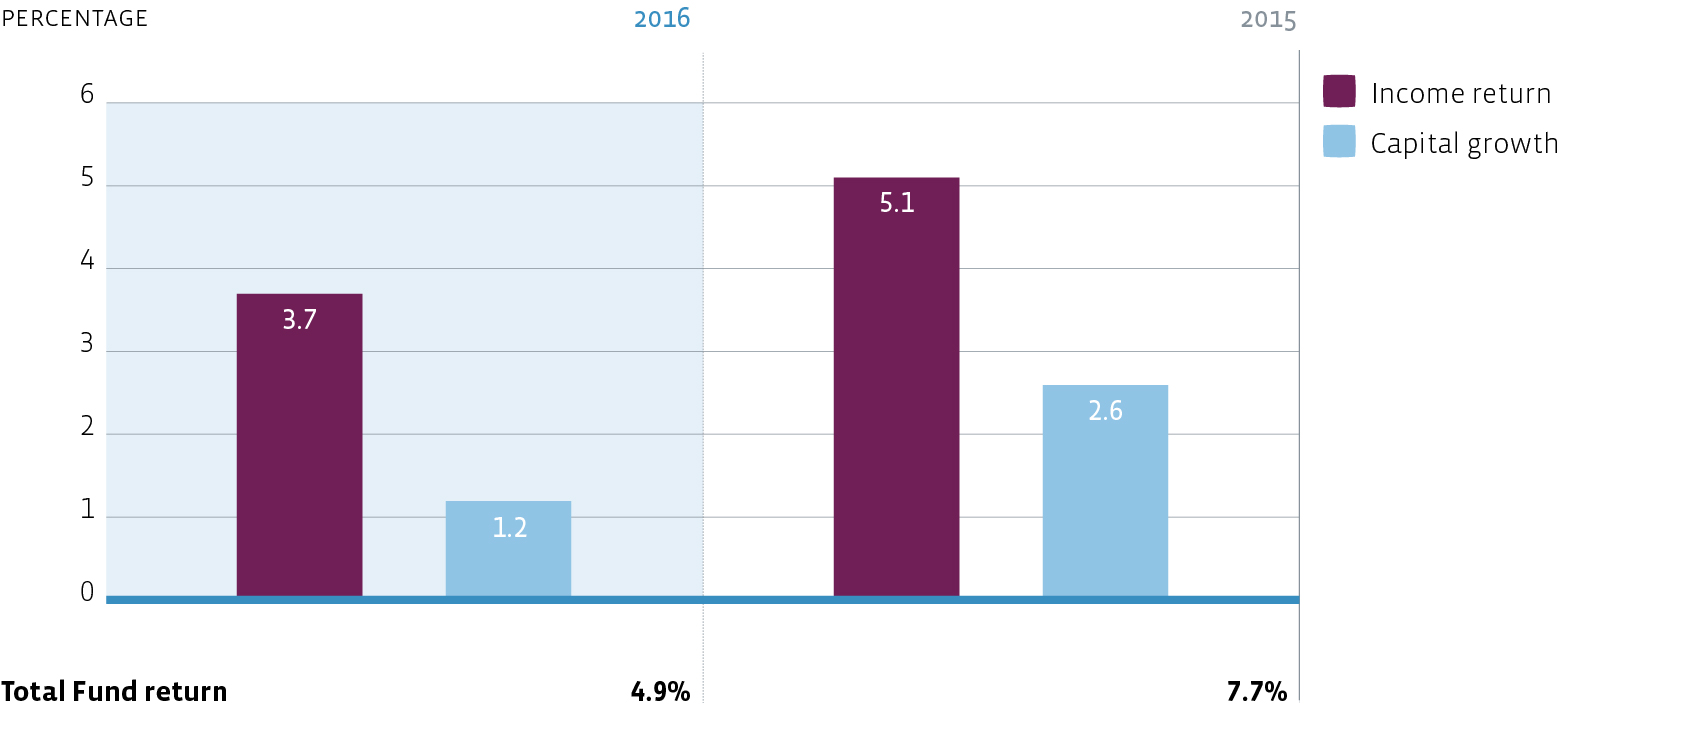
Income return
The Fund booked an income return of 3.7% in 2016 and is 1.4%-point less than 2015 (5.1%). Income return as percentage and in euro is lower mainly because of the sale in December 2015 of Bewegingshuis, Zwolle, a non-health complex with a relatively high return compared to health projects. The addition to the portfolio of van ‘t Hofflaan and Martha Flora with lower returns could not compensate for the sale of Bewegingshuis.
Capital growth
At 1.2%, capital growth is 1.4%-point lower than 2015 with 2.6%. Capital growth is derived from the valuation results from investments and properties under construction, and is adjusted with amortisation of capitalised acquisition costs. The reason for the lower performance is that the Fund has several properties under construction and valuation results for properties under construction are negative, absorbing to a large extent the positive valuations of the investments in operation. And although valuation results for investments in operation are higher than 2015, they did not compensate for the valuations .
Property performance
The total property return for 2016 came in at 5.5% (2015: 7.7%), consisting of a 5.5% direct property return (2015: 6.3%) and a 0.1% indirect property return (2015: 1.3%).
The fund return (INREV) and property return (IPD) are different performance indicators. The fund return is calculated according to the INREV Guidelines as a percentage of the net asset value (INREV NAV) and the property return is calculated according to the IPD methodology as a percentage of the value of the investment properties. INREV e.g. includes cash, the fee costs and administrative costs in the calculation of the income return (INREV). Furthermore the amortisation of acquisition is threated differently by INREV and IPD.
Rent and occupancy
Rent in arrears came in at 0% of the gross rental income for 2016. As there are currently only master leases, financial occupancy is 100%. Net rental income decreased slightly from € 1.7 million to € 1.6 million in 2016, due to the sale of Bewegingshuis in December 2015. Since then, only Martha Flora Haarlem came into operation as of December 2016. Like-for-like rental income shows an increase of 0.8%
Acquisitions
Signed acquisitions amounted to € 46.5 million. However, another € 64.3 million was approved by the Management Board of the Fund. But these contracts have taken more time than initially anticipated and the Fund is in the process of concluding contracts which will be signed in the first and second quarters of 2017.
Capital Management
Treasury management
For treasury management The Funds acted accordingly to its treasury policy in 2016, in order to manage liquidity and financial risks for the Fund. The main objectives of the treasury management activities were to secure shareholders’ dividend pay-out, as well as managing the Fund’s cash position.
At year-end 2016, The Fund had € 8.5 million in freely available cash. During 2016 the cash position decreased by € 1.7 million, as compared to year-end 2015. During 2016, The Fund paid € 1.4 million as dividend to the shareholders. Also during 2016, two capital calls were executed at a total amount of € 20 million.
Interest rate and currency exposure
During 2016 the Fund was subject to the negative interest rate development for its bank balances. As the Fund has no external loans and borrowings, it has no exposure to related interest rate risks. The Fund did not had any foreign currency exposure during 2016. As result the Fund had no exposure to currency exposure risks.
Dividend and dividend policy
The Board of Directors of the Fund proposes to pay a dividend of € 54.06 per share for 2016 (2015: € 31,470), which corresponds to a pay-out ratio of 100%. In the first quarter of 2016 € 24.955.000 share premium has been swapped into 24.955 new shares of nominal €1.000 each. As result, the dividend per share shrank substantially. It is proposed that the dividend be paid in cash, within the constraints imposed by the company’s fiscal investment institution (FII) status. Of this total dividend, 74.9 % was paid out in 2016 and the fourth dividend payment will be paid on 7 March 2017. The remainder of the distribution over 2016 will be paid out in a final instalment on 25 April 2017, following approval by the Annual General Meeting of Shareholders to be held on 19 April 2017.
Tax
The Fund is structured as a fiscal investment institution (FII) under Dutch law and is therefore not subject to corporate tax. Being an FII, the Fund is obliged by law to maintain a pay-out ratio of 100% of the Fund’s distributable profit; as stated above, the Fund proposed to pay out 100% of its distributable profit. The Fund met its obligations related to value added tax, transfer tax and other applicable taxes in their entirety in 2016.